


You Need Data to Write a Fair Engineering Performance Review
How to reduce engineering performance review bias with data

There is a lot of skepticism about using data for engineering performance reviews.
Bad managers have a long history of abusing data, such as stack ranking and firing people based on lines of code.
However, these abuses are not an indictment of data itself. When applied properly, it can fill critical knowledge gaps and provide clarity for managers rather than dehumanizing them by trying to replace their judgment.
There’s no such thing as a data-free review either. Managers who “don’t use data” are really just relying on qualitative data from their own memory.
Unfortunately, human memory is severely biased, even with the best of intentions.
The performance appraisal Wikipedia page has a good list of reasons why managers misjudge performance that should cause concern, such as Recency Bias (overweighting more recent events because they’re easier to remember) and Halo Effect/Horn Effect. Here’s a quotation about the halo effect in particular:
"In the work setting, the halo effect is most likely to show up in a supervisor's appraisal of a subordinate's job performance. In fact, the halo effect is probably the most common bias in performance appraisal. Think about what happens when a supervisor evaluates the performance of a subordinate. The supervisor may give prominence to a single characteristic of the employee, such as enthusiasm, and allow the entire evaluation to be colored by how he or she judges the employee on that one characteristic." (Schneider, F.W., Gruman, J. A., & Coutts, L. M., Applied Social Psychology, 2012)
If you think experienced managers are immune, then you are mistaken (and also possibly falling victim to the bias blind spot – a bias that makes you think you’re less biased than other people).
I have been managing engineers for over a decade, and still ran into my own bias during a recent review. Before digging into the data, I had an overly negative impression of an engineer’s performance due to recent struggles with a big project.
After more deeply exploring his metrics, however, his performance was only worse for the month he was working on that project. The rest of the year, the metrics were similar to others on the team.
If you want your performance reviews to be fair, you need to use data to cover your blind spots.
This article shares several metrics that you can use to get a more holistic view of engineering performance in three key areas: recognizing contributions, pace of work, and quality.
Recognizing contributions
The first thing a performance review should do is recognize an employee’s meaningful contributions. This affirms that the manager both notices each contribution and recognizes its value.
Managers should expect any contribution that they fail to recognize to not happen in the future.
It’s particularly important to include things that go above and beyond the normal call of duty and are less visible, like working extra hours, helping out others, handling behind-the-scenes grunt work, or having a positive attitude under difficult circumstances.
Managers should also make an extra effort to understand the accomplishments of people who don’t like to brag about their work. Failing to do so creates a toxic culture of brown-nosing that drives away humble performers.
Below we’ll look at several ways data can highlight easy-to-miss engineering contributions.
Development effort by project, work type
The first metric you should look at is the total amount of engineering effort dedicated to each project during the performance review period based on assigned tickets.
This can take the form of a pivot table in a spreadsheet that aggregates story points, ticket counts, or time logs by epic for each assignee. minware’s individual contributions report can also tell you more precisely how people spent their time based on their commit activity.
It’s especially important here to break down the “none” bucket for tickets that aren’t part of a project. Many engineers spend a significant portion of time on miscellaneous non-project tasks like bug fixes and maintenance.
If you don’t have consistent issue types, parent tickets, or labels for non-project work types, then you should sample some of those tickets and categorize them to better understand where time went.
Failing to recognize people for bug fixes, maintenance, and stakeholder requests will ultimately lead to that work being neglected, which you probably don’t want.
Unticketed work
It’s also essential to look at people’s contributions beyond their assigned tickets. There are many ways that people help out on a team that are important to recognize.
As a manager, you should dig into each system where people operate to sample their activity during the evaluation period. Ways to do this include searching through email, slack channels, or documentation systems by a person’s name.
You can also run reports in your ticketing system to see how many tickets the person created or commented on without being assigned.
Similarly, you can see their code reviews by searching your version control system.
This may be a bit difficult to do depending on your Git provider, but you should also look at commits and merges for PRs opened by others to see how much of the time developers helped out on tickets assigned to others.
minware’s individual contributions report covers some of this by including code reviews and ticket creation. (Its work time metrics naturally count time spent on commits associated with other people’s tickets.)
Finally, there is the human factor. All this data will tell you what someone did, but it’s up to you to interpret the data and decide what had the biggest impact. You should also solicit feedback from others on the team and combine everything you’ve learned into a comprehensive assessment of your employee’s contributions throughout the year.
Assessing the pace of work
After recognizing contributions, the next thing you may want to assess is how much effort it took to deliver those results, and whether that level of effort was appropriate. This section covers a few metrics that can help with assessing the pace of work. (Though this list is not meant to be comprehensive and you may want to look at other metrics depending on your situation.)
Velocity Metrics
Here, the classic story point velocity metrics can be helpful. Velocity has its limitations, but can work well when comparing one person’s pace of work to previous time periods (keeping in mind that sometimes velocity fluctuations are caused by inaccurate estimates rather than less work getting done).
Looking at points or other estimate units completed every sprint (or every few weeks if you’re not using sprints) can identify hot spots where the engineer completed less estimated work than usual during that period.
If you have time logs or you’re using a system like minware, you can also create a report that divides story points by the time spent on each ticket, which gives you precise visibility into which projects and issue types had lower than normal estimated velocity.
Here’s a chart I looked at showing points completed per day for a particular person, broken down by ticket point estimate. You can see here that July had much higher velocity and November’s was lower:
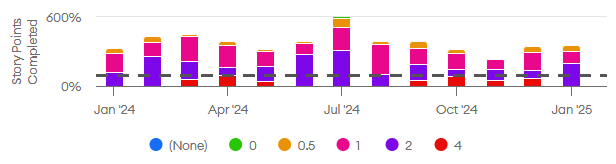
Once you’ve identified projects, issue types, or time periods with lower-than-average velocity, the next step is to figure out why the velocity was lower by looking at specific tickets and pull requests.
Low-than-usual velocity can have many different causes, some of which are outside of the engineer’s control. Here is a list of common causes, but there are many more:
The engineer had to redo work because functional or technical expectations were not clearly defined, or because they failed to meet established expectations.
Tasks were overly large or complex and should have been broken down into smaller units.
The engineer went down a rabbit hole pursuing a bad solution when they should have discussed it sooner with others.
The task was too difficult for the engineer, or they were learning a new area of the software.
The type of work was fundamentally difficult to estimate (e.g., fixing a set of bugs with unknown size, such as when upgrading major dependency versions).
The task was underestimated due to lack of experience.
There was insufficient planning and the engineer encountered problems that could have been anticipated.
The task had scope creep or shifting requirements.
There were interruptions or other unticketed responsibilities that took from completing assigned tickets.
Product management failed to provide clear direction about valuable work to do.
However, determining the root cause by looking at raw data can be cumbersome.
Next, we explore metrics that can help with understanding the root cause of velocity fluctuations.
Work in progress (WIP)
Workflow metrics can show you why there are changes in the underlying velocity.
The first one I always look at is work in progress (WIP), a classic metric for lean process efficiency. There are various Jira plug-ins that can calculate this metric for tickets, and minware can do it for both tickets and code branches in the lead/cycle time and workflow report. Here is a chart for one person’s work-in-progress on our team, which has been increasing over the past few years and has had some spikes in recent months:
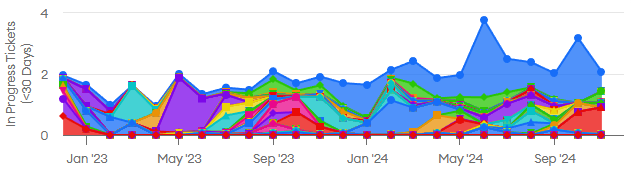
High work in progress can significantly reduce the pace of work due to the overhead of context switching.
When you see high work-in-progress, you should drill down into the data to see which tickets are blocked/waiting and why the person is unable to make progress on them.
This can happen for many reasons. In the context of a performance review, you should assess whether the engineer could have done anything differently to reduce WIP, like break work into smaller tasks, ask for help or review sooner, better plan to avoid blocking dependencies, etc.
PR lead time for changes by stage (PRLT)
The next metric that can be illuminating is pull request lead time (PRLT) by stage (e.g., from first commit to opening the PR, open to receiving review, review to merge).
Here is a chart that compares median PR lead times (in days) for two engineers on our team:
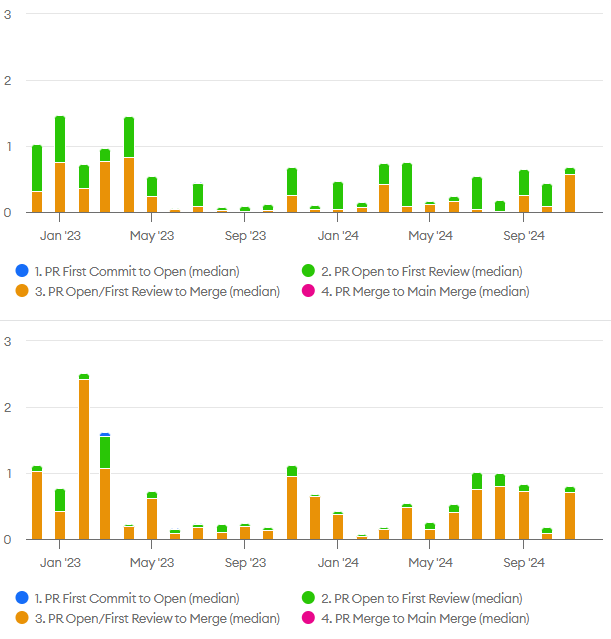
The median lead times for these two engineers were not that different this past year. However, the lead times by stage were much different. The first engineer spent most of that time waiting for review, while the second engineer spent most of that time after receiving a review.
One underlying issue I discussed with the second engineer was having too much work in progress. In particular, he was opening a pull request for review, starting on the next task, but not coming back to the pull request review until the next task was complete. This was causing pull requests to sit around for longer than necessary.
(On the left side of the top chart, the engineer had just joined the company. Also, in May 2023, he shifted responsibilities from application development to operations, which has smaller task sizes. On the left side of the bottom chart, the engineer was also newer to the company.)
Development Time by PR Status (DTPR)
In addition to PR lead times, active development time by pull request status (a minware-specific metric) is also helpful. It provides deeper visibility than PR lead time because PR lead time doesn’t tell you whether active work is happening or if the task is just sitting around.
These charts show that not only was there a difference in total lead time between these two engineers that could be explained by pull requests sitting around post-review, but also a difference in the amount of active development effort that went into pull requests before and after receiving a review. The 2024 average was around 50% post-review dev time for the second engineer and 30% for the first one:
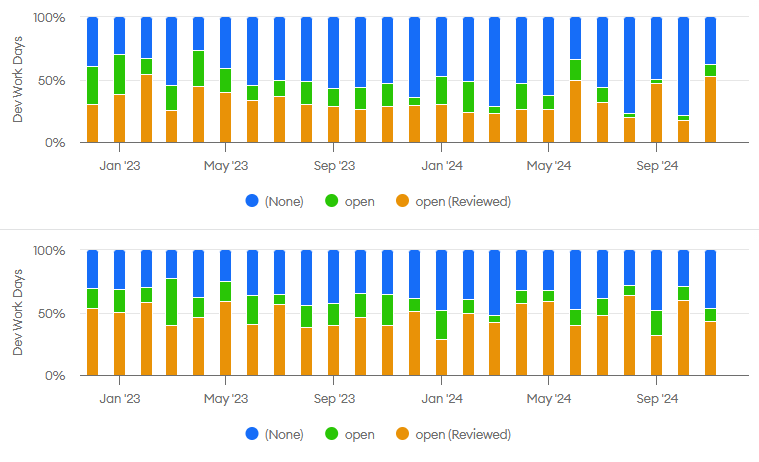
The underlying cause in this case was that the second engineer’s pull requests received more requests for changes during code reviews due to a difference in task difficulty vs. skill set.
I shared feedback with the second engineer about things he could do to improve code quality prior to opening pull requests so that fewer changes were needed. The feedback called out coding anti-patterns, but the metrics helped show the size of the opportunity to improve (i.e., reducing 50% of time spent post review to a level in line with others on the team around 30%).
Other pace-of-work metrics
You may have noticed that the metrics shown above don’t cover tasks that took longer than expected without any context switching or rework.
This can happen in theory. In my experience, however, almost all dips in velocity are associated with significant rework or context switching. Tasks that are done correctly the first time in one contiguous interval usually hit their estimates.
Your situation may vary though and you should look for metrics that help you trace back drops in velocity on your team to their root cause.
Evaluating work quality
Looking at PR lead times and PR development times by status may provide insights about quality, but only for issues that are detected before merging code.
To get a holistic view of engineering work quality, you should also look at how code fares over time in production. This section highlights a few helpful metrics that can give you a better view of quality.
Bug Creation Rate
People often pay attention to severe issues like outages, such as with the change failure rate (CFR) metric, which is part of DORA.
If someone regularly ships bugs that cause outages, that is definitely something to address.
However, a majority of bugs are usually low or medium priority. Someone who creates a lot of them still needs guidance about getting better because those bugs can have a significant impact in aggregate.
The metric I like to look at is new bugs (of any priority level) per active work day of development (NBD), which you can see in the CFR/Bug Creation minware report.
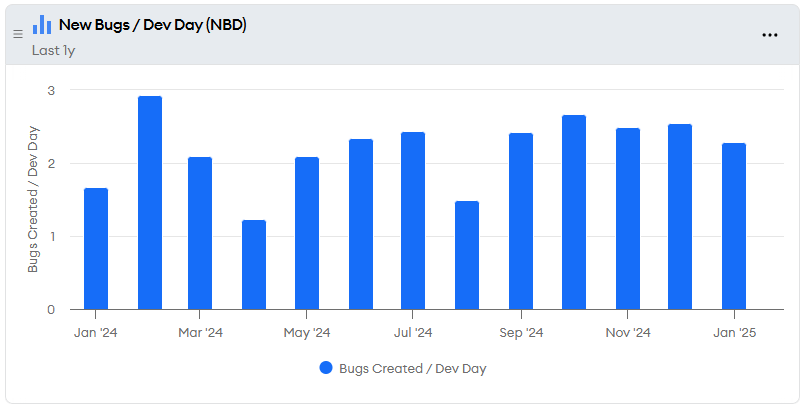
For this metric to be relevant to an individual, you also need a way of attributing bugs to the person who created them. If the team has a practice of assigning bugs to that person, then you can group by assignee.
However, you may need to manually assess a sample of bugs to mark which people or code areas generated them.
When you’re looking at the bug creation rate, it’s also important to consider that someone who works in repositories with fewer tests and lower code quality will create more bugs through no fault of their own.
One thing that can help is to go through specific bugs and determine what would have been necessary to catch each one before launch.
If you do this enough, patterns will emerge that help you identify specific areas of improvement for people whose modifications cause bugs, as well as for teams or code owners to make their code easier to modify.
Non-bug load
Sometimes, velocity will look great, but the team mysteriously struggles to get anything done.
This can occur when people cut corners on quality to “finish” their tickets, knowing that they will get credit for completing more story points when bugs pop up in the future.
If you think this might be happening, then you should look at how much time the team is spending overall on bugs and whether it is at a healthy level. This is a screen shot of our numbers for minware from the CFR/Bug Creation report:
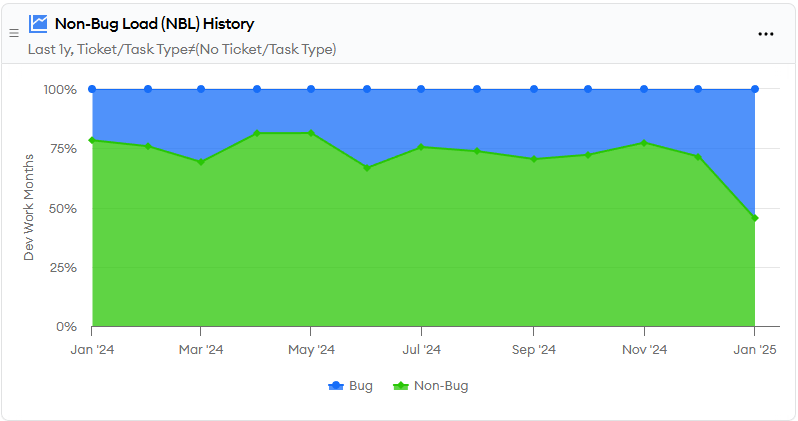
Our numbers have been fairly consistent until this month, as we’ve recently fixed a lot of bugs that were discovered by improvements to our testing infrastructure.
This metric shows you the impact of quality problems on velocity, which helps you decide how much to emphasize quality improvements as part of the performance review process.
Bug fix vs. find rate (BFFR) and average bug backlog size (ABBS)
Finally, a trap that teams sometimes fall into is sweeping bugs under the rug, so to speak. If bugs don’t seem like a problem for you, you should double-check that they are actually being discovered, filed, and fixed.
First, you should verify that customers are using the software and that there are good mechanisms to detect and report bugs. If the customer service team doesn’t have access to your bug tracking system, for example, you could have a lot of issues that you’re not seeing.
Assuming bugs are getting filed, you should look at your fix. vs. find rate and average bug backlog size (also available in the CFR/Bug Creation report).
If the numbers are significant, you should assess which bugs aren’t getting fixed, and if they are being created by a different person or part of the code than ones that are being fixed. (This may be difficult to do if the bug isn’t fixed yet though, which is why I strongly recommend fixing all your bugs.)
Addressing the issue of not fixing bugs is probably more of an issue for the product manager than for engineers, but you should be extra diligent in your assessment of work quality if the team doesn’t even know the impact of bugs because they’re deferring them until later.
Caveat on quality improvements
One important caveat with judging the quality of work done by an engineer in a performance review is that you need to account for management pressure to cut corners on quality to get projects out the door.
If you want people to improve quality, then you have to let them either cut scope or take more time. If people are told by management to hold scope and time constant, then it’s not their fault when quality suffers.
Similarly, if you ask someone to improve quality, you should specify whether to cut scope or to extend timelines to make it happen, because they will have to do one of the two.
Conclusion
An engineer’s job is extremely complex and using data in performance assessments is a deep topic. We’ve covered several here that can help build a more objective and complete understanding of engineering performance, but this really just scratches the surface.
The most important thing to take away is the role that data should play in performance reviews.
Qualitative metrics should assist and enrich the manager’s understanding of performance in conjunction with expert analysis and other data sources like qualitative feedback. It should not replace or supersede the manager’s judgement.
Engineering managers who use data wisely will write better performance reviews that guide employees toward the highest-impact growth opportunities and ultimately accomplish more with the members of their team.