Yes, You Can Measure Technical Debt
How to calculate costs and build the business case for fixing technical debt
Managing technical debt is perhaps the CTO’s most important responsibility.
Fix too much and end up like Netscape.
Fix too little and end up in a tech-debt death spiral.
Disagreements about whether to fix tech debt are also a common point of conflict between engineers and non-technical leaders.
Engineers feel the pain firsthand, with an innate sense of how much easier their lives would be given a clean, well-structured code base and 100% test coverage.
But is it worth it?
This is the million dollar question.
The default response from CEOs is often: “If you can’t prove the value, you can’t put it on the roadmap.”
A recent VP of engineering candidate told me about how his CEO repeatedly denied resources for a critical refactoring project. What finally got him to change his mind? A projected cost savings analysis denominated in dollars.
And that is not unreasonable.
Engineers are paid in dollars and customers pay dollars. It’s hard to rationalize doing something with an uncertain benefit when the alternative is shipping valuable new functionality that increases revenue. Also, if a CTO can’t estimate the monetary benefit of refactoring, how can the CEO be expected to do it?
The problem is that measuring the impact of tech debt is difficult. It’s not like you have two software versions side-by-side where you can make the same changes to each and see how much harder it is with legacy code.
Even worse, tech debt compounds. As legacy software gains dependencies, it becomes harder and harder to fix.
The real tragedy occurs when engineers are right but fail to convince leadership that fixing tech debt is important, leading to a death spiral where everyone loses.
The key to staying on top of tech debt is measuring its cost and fixing the important pieces before they get out of hand.
This article first looks at measurement strategy, covers different approaches for manually measuring tech debt, and then shows how to automate the process.
Tech debt measurement goals and strategy
Before getting into the details of technical debt measurement, it’s important to understand the goals and strategy.
The reason for measuring technical debt is to calculate the value of fixing it as compared to adding new functionality, and ultimately decide which projects have the highest return on investment.
The primary benefit of fixing tech debt is usually time savings, though there may be other benefits like improved security, performance, quality, or morale.
This savings will also happen in the future, which is subject to uncertainty depending on how much the software will be modified.
For the purposes of prioritization, the measurements will be divided by the estimated implementation cost, further amplifying uncertainty.
There are other factors too, like how not fixing certain tech debt may increase the cost of fixing it later, and allowing tech debt to grow too much can cause talented people to leave or cut off strategic business options.
In the end, we will use tech debt measurements in a context where there are a lot of unknowns. We therefore can’t expect a high level of precision.
The goal should be a ballpark estimate within 2-3x of the true cost to at least make sure that we don’t ignore any major ticking time bombs. You can then put your finger on the scale a bit during roadmap planning if there are other significant factors like compounding dependencies.
As an approximation, the current portion of time spent on tech debt (extrapolated over a time horizon like 2 years) is a reasonable estimate for the benefit of fixing tech debt for the purposes of roadmap planning.
How can you measure time spent on tech debt?
This is where it gets tricky. Unless you’ve already fixed the tech debt and are also maintaining a legacy version, you aren’t going to have ground truth about its cost.
Ask engineers
One approach is to rely on expert opinion. That is, ask engineers how much time they wasted on issues caused by technical debt.
I did this in the past with a spreadsheet that teams would fill out during each sprint retrospective. Each person would enter the percentage of their time they feel like they lost to tech debt “interest,” as well as time they spent resolving tech debt “principle.”
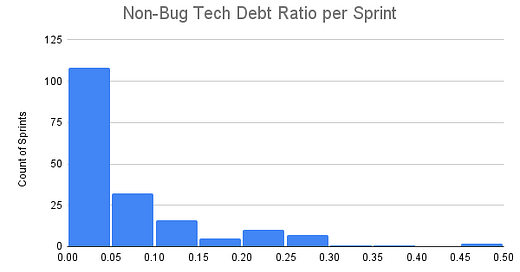
Over a span of about two years with four teams, the average percent of time engineers reported losing to tech debt was 7%. However, as you can see in the histogram below, most sprints had under 5%, while a minority of bad ones were over 20%.
As a manager, I focused on the bad sprints where tech debt went beyond minor annoyance and was a major problem. I then dug into the specific root causes to make sure they were addressed.
The downside of this approach is that people are sometimes biased in either direction. Engineers may report a higher amount of technical debt if they experienced a small but particularly frustrating issue.
On the other hand, each person’s definition of tech debt is different. Junior engineers in particular might not have a good reference point for what developing software in a high-quality code base looks like, and can easily normalize and under-report real issues.
Though we were pretty on top of fixing technical debt, the overall 7% number feels low, so it’s worth looking at things from another angle.
Measure bugs
Beyond slowing down feature work, another major way that tech debt manifests is by creating bugs.
There’s no such thing as bug-free software, but code with a lot of tech debt also tends to generate a lot more bugs.
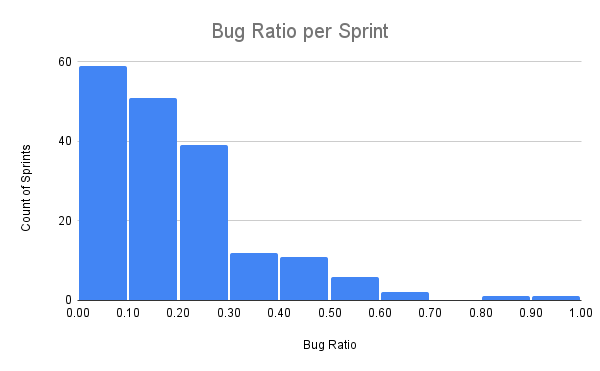
Part of the reason the overall tech debt number in the previous section is only 7% is that the self-reported number only covered non-bug tasks and bugs were counted separately. Bugs represented an additional 19% of all story points completed, for a total of 26% bugs and non-bug tech debt combined.
This histogram shows a percentage of each sprint’s story points spent on bugs, which is much more substantial than points attributed to non-bug tech debt:
The challenge with bugs, however, is deciding what they mean. They’re small and there are a lot of them. It’s usually not easy to attribute a given bug to a particular piece of tech debt.
In theory, any bug could have been prevented with better test coverage and/or static checking. However, knowing in advance how many future bugs will be prevented by particular test coverage or refactoring is hard.
Going back to the VP of engineering candidate I mentioned earlier, he required developers to record the module that was the root cause of each bug when closing it. This showed that one module in particular was responsible for an outsized portion of bugs, justifying an overhaul.
When you’re considering the bug cost of tech debt, a good approach is to start from the tech debt you know exists, and then find ways to identify bugs that would go away if it were fixed.
For example, you can look at particular repositories, folders, file extensions, or bug classes. If you’re considering the priority of moving from Javascript to Typescript, you can look at undefined reference errors in .js files and be reasonably certain those bugs would disappear.
Quantify estimate misses
Asking engineers to record tech debt adds substantial overhead, and the data is not reliable unless recorded in real-time because people forget.
Another proxy for the impact of tech debt on non-bug issues is missed estimates.
The VP of engineering candidate mentioned previously also required engineers to fill out an “actual story points” field when closing tickets to collect information about estimate misses. He then added this to time spent on bugs to get an overall tech debt estimate by module.
You can also get this information with time logs or a system like minware. If you want a DIY solution, you can import pull request commit data from GitHub and look at the count of days with active commits compared to story points on tickets linked from pull requests.
Estimate misses aren’t a perfect metric. There are many problems besides tech debt that can cause estimate misses, and engineers may buffer their estimates based on the presence of tech debt.
Nevertheless, if you look at estimate misses in aggregate and group them by system component (such as by filling it out as a Jira ticket field as mentioned earlier), then you can approximate tech debt overhead by looking at the difference in estimate misses between problematic components and those with less tech debt.
The advantage of estimate misses over asking engineers about tech debt is you’re no longer subject to personal biases from normalizing problems, overestimating the impact of frustrating issues, or the fallibility of human memory. The truth lies in the numbers.
How to automatically track tech debt
Manually tracking tech debt takes a lot of time. Many people, including myself, have found the trade-off worthwhile to make better decisions about managing tech debt.
However, it’s better if you automate the process, particularly because that gives you historical data, which is useful, but rarely worthwhile to go back and label.
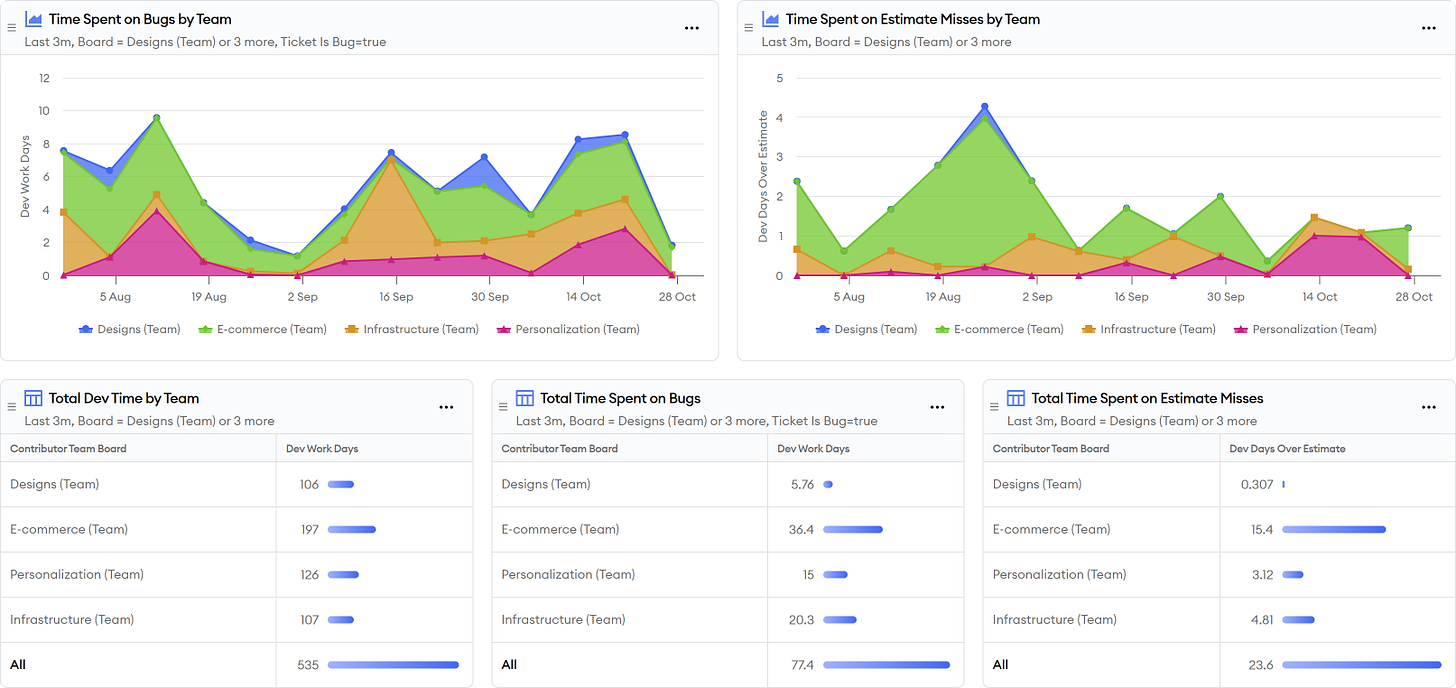
We’ve created a tech debt cost report in minware that lets you quickly set up an automated solution:
The report uses minware’s time model to calculate the amount of effort spent on each ticket based on commit data and links between pull requests and tickets.
What you consider an estimate miss might vary depending on your team and organization.
The report shows the average number of dev days spent per story point, which you can then use to set a days per point threshold above which you count time as over the estimate. The default is double the average, which leaves room for story point estimates being approximate while still counting time that is significantly above what is expected for a given story point level.
The next part is deciding how to slice the cost of bugs and estimate overages. The report defaults to doing it by team, but you can also edit the report to aggregate by repository or custom ticket field to look at tech debt overhead in different ways.
Finally, this report shows the numbers in time rather than dollars. If you want to report on total personnel cost, you can update the values to multiply them by average engineering salaries in your organization.
This report requires a lot of org-specific configuration since everyone’s tech debt situation is different. If you want to chat more about tech debt, just send me a message – I’d love to hear from you!
Conclusion
For many engineering leaders, managing tech debt is the most challenging and critical part of their job.
It’s challenging because the costs are elusive and decisions often default to gut feel.
Measuring technical debt isn’t a cake walk, but it is possible with the approaches outlined in this article.
The silver lining is that most companies struggle badly with tech debt management. If you do it well, you can gain a significant leg up on your competitors.


Working with startups, I've found a third type of "debt" to be common: Situations where you ship a MVP type feature, knowing that it's not fully baked - cutting corners for the sake of meeting a deadline. Usually this is something innocuous done with full visibility - something like deferring work on an administrative tool or support for a less-used option. In the moment it's always justifiable in the name of making that next big sale, but it's easy to forget (or the business forgets) and those items pile up. Because the urgency of "meet that deadline" is gone, the nontechnical driver for the feature is gone as well. I wouldn't categorize those as technical debt (although you could make a case for it) and they may certainly end up as bugs at some point. How do you recommend those items be categorized and measured, as techdebt or bugs or something different?